
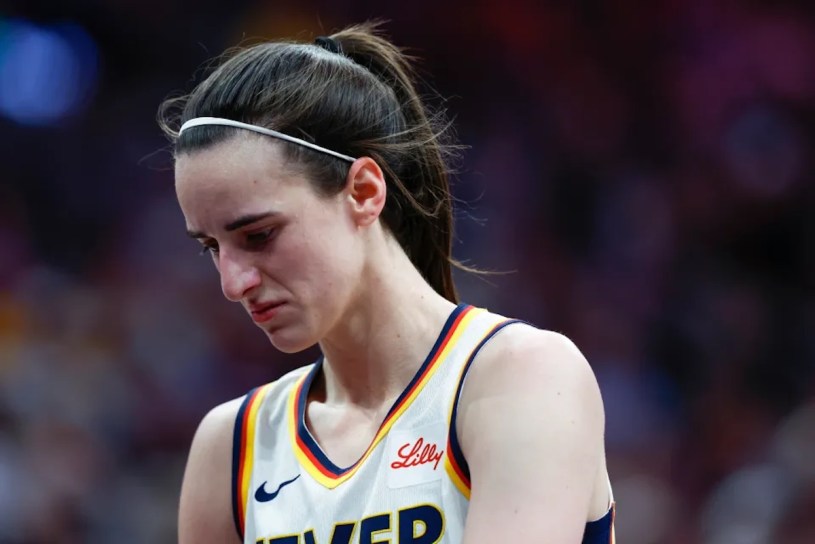
It’s time for another WNBA Tuesday column today, and while trying to avoid controversy, we also have a duty to report on facts when other sports “experts” will not do so, for whatever reason (usually financial but also due to the statistical illiteracy of the audience, in truth). So, we’re here to check in on Indiana Fever guard Caitlin Clark, the media darling who rates pretty low sabermetrically among her peers, both on her own team’s roster and especially in comparison to real WNBA value leaders.
The season is more than halfway over, with most teams having played more than 22 games. It’s a good data sample size to use for this analysis. First, these are Clark’s advanced analytical rankings on her own team:
- Player Efficiency Rating (PER): Third (20.0)—team leader Aliyah Boston (23.9)
- True Shooting Percentage (TSP): Eighth (.570)—Sophie Cunningham (.684)
- Effective Field-Goal Percentage (eFG): Tenth (.507)—Cunningham (.640)
- Total Rebound Percentage (TRB): Eighth (8.7)—Boston (18.7)
- Assist Percentage (AST): First (44.8)
- Steal Percentage (STL): Ninth (1.2)—Boston (1.9)
- Block Percentage (BLK): Seventh (1.5)—Boston (3.9)
- Turnover Percentage (TO): Eleventh (20.7)—Kelsey Mitchell (9.3)
- Usage Rate (USG): First (32.4)
- Offensive Rating (ORtg): Eighth (108)—Cunningham (130)
- Defensive Rating (DRtg): Seventh (109)—Boston (103)
- Offensive Win Shares (OWS): Fifth (1.1)—Mitchell (3.0)
- Defensive Win Shares (DWS): Third (0.6)—Boston (1.2)
- Total Win Shares (WS): Fifth (1.7)—Mitchell (3.5)
- Win Shares per 40 Minutes Played: Sixth (0.123)—Boston (0.197)
Clark’s singular value offering that stands out as “the best” on the team is her assist rate, which is sadly counteracted by her poor turnover rate. This has been ignored by the media since she first entered the league and obliterated the all-time record for most turnovers in a single season. We made the correlation once to a quarterback who tops the NFL in both touchdown passes and interceptions; the reality is that all the good is undone by the bad there, no matter what way you slice it. But honest facts?
It’s a terrible reality about Clark’s game that barely any mediots report. Clark’s shooting is mediocre at best, even on her own team, and her defense is middling without any standout data to report there. She’s not particularly bad on defense, and on a team of average defenders, she actually brings more value on defense than offense—which is ironic, since “scoring” is supposed to be her forte. We see this is not so much the case in that ORtg mark and the OWS value. The overall added value? It’s just not there, folks.
The total WS mark is affected by playing time, and Clark has been injured here and there. The WS/40 mark reduces value to its most straightforward: she is sixth on her own team when she’s actually on the court. Her ORtg and DRtg show where she ranks among her teammates in both phases of the game, and it’s clear Clark is not even close to being the best player on her own team—let alone the best guard, which is clearly Mitchell right now, followed by Cunningham (who plays less). Let that sink in, please.
Now, why is this player considered “the best”? We do not know. There is little data to support that, except for the singular value of her assist rate, which is stellar. But everything else in her game takes away from that one positive and makes her overall impact on the team minimal and hovering in the middle of the roster, in truth. These are the sabermetric facts. Now, let’s look at her sabermetric status among colleagues and peers in the entire WNBA next, using a basic “Top 20” approach for an alleged star:
- PER: 17th (20.0)—Boston is second
- eFG: not in the Top 20
- TSP: not in the Top 20
- WS: not in the Top 20—Mitchell is ninth, while Boston is 17th (2.9)
- OWS: not in the Top 20—Mitchell is third, while Boston is 20th (1.7)
- DWS: not in the Top 20—Boston is 17th (1.2)
- ORtg: not in the Top 20—Cunningham is second, while three other Fever players are also in the Top 13
- DRtg: not in the Top 20—Boston is 13th
- USG: Second—the league leader is A’ja Wilson (33.6), who also ranks first in PER and second in WS
- TRB: not in the Top 20—Boston is fifth, and Fever forward Monique Billings (16.4) is 11th
- AST: first
- STL: not in the Top 20—no other Fever player is, either
- BLK: not in the Top 20—Boston is ninth, and Billings is 20th (2.5)
- TO: not in the Top 20—Mitchell is tenth, and Cunningham is 17th (10.4)
The PER mark is the most complimentary piece of data to suggest Clark is a “great” player, overall. But even at 17th in the league, that’s not someone who should be starting the All-Star Game, and again, it’s a singular example as the WS mark doesn’t augment it well, nor does the WS/40 figure. So again, Clark makes some great passes, but two guards on her own team are more valuable overall, as they shoot better and don’t turn the ball over anywhere near as much. In fact, they’re protectors of the ball unlike Clark.
Every turnover is not only a missed chance to score, but it’s an extra opportunity for the opponent to score. The same with a missed shot, so that’s the straightforward explanation of why Clark’s overall value is average: the Fever are not a great defensive team, and when they give the other team extra chances to score, that hurts them a lot. The singular thing Clark does well is erased by the multiple things she does poorly that create chances for the opponent—not just on her own team but in the full WNBA rankings.
Remember, facts matter; feelings aren’t defensible in the face of hard, verifiable data—ever. Clark’s assist rate alone can be reason for her to be on an All-Star team, but everything else in her sabermetric profile makes her an ASG benchwarmer, at best, really.

